March 22 Chart of the Day - Nike
Precision oriented price action technical analysis by far provides the best edges and most setups for traders across the markets so that's what we use for the basis of our reviews.
Nike (NKE) reported holiday sales that beat expectations, but reported less than a rosy outlook as its growth in China continued to slow. Shares fell today over 6% down to the $92 area.
Seeing a headline like this we decided to take a look at their chart from a price action technical analysis perspective to see where price could be heading.
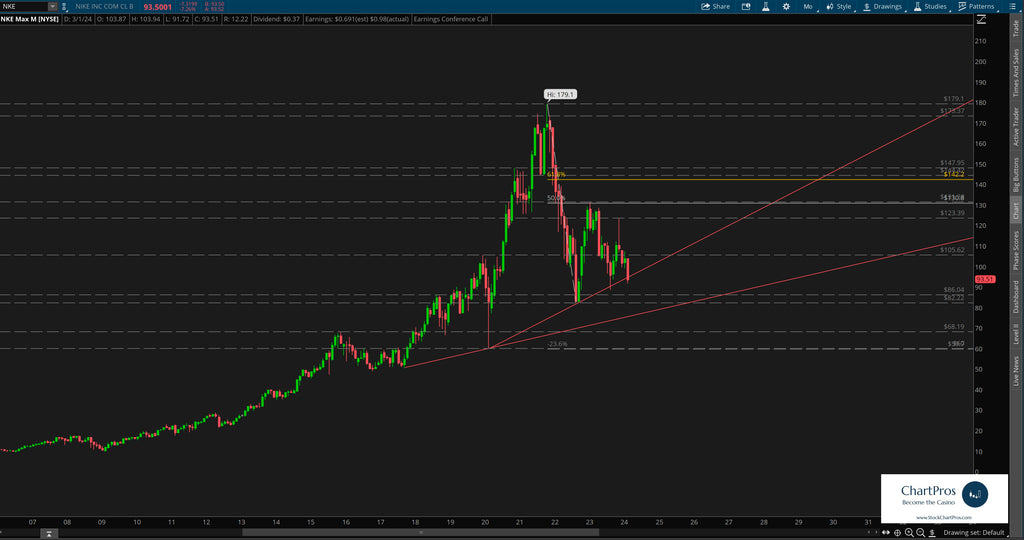
On the monthly chart we can see that price has pretty much traded sideways the last couple of years with approximately $105 the mid range roughly between $85 and $122.
Each time price attempted to break away from the mid range it seemingly returned to that $105 area.
With price heading down towards the lower end of the range it will be interesting to see if the Nike bulls step in to potentially push it back up towards the mid point yet again.
At the current level price may have an upcoming decision to make...
Monthly Chart
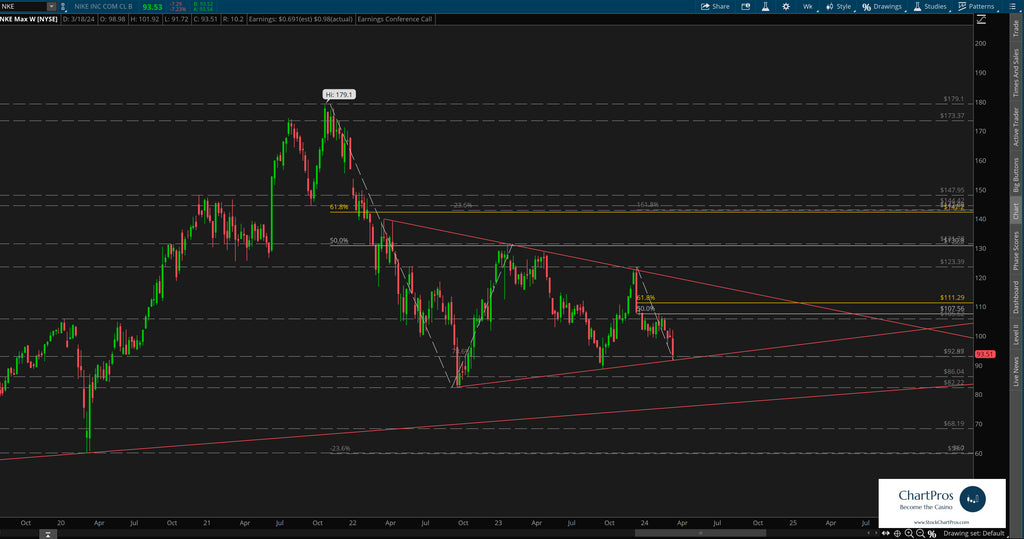
Down on the weekly chart we can see what apparently may be a "last chance" area for the bulls to step in before price could possibly fall more.
If nothing else, price may get a relief bounce in this area before making a more permanent decision.
Weekly Chart
Armed with precision oriented charts like these both traders and investors can formulate their respective plans.
So what's next?
We don't make predictions...
Nobody knows for sure but using these 5 price action tools traders and investors can develop levels of interest in both directions.
- Support/Resistance
- Trend
- Fibonacci
- Supply/Demand Zones,
- Change Control Zones
ChartPros provides the exact methodology in its price action technical analysis courses to create charts like this with the most precise and accurate levels from which investors and traders can formulate their respective trade plans.
Take a look at the charts and let us know what you think.
We'd like to hear from you in the comments sections.
