March 27 Chart of the Day - SoFi Technologies
Precision oriented price action technical analysis by far provides the best edges and most setups for traders across the markets so that's what we use for the basis of our reviews.
SoFi Technologies, Inc. (SOFI) is a San Francisco based online personal finance company and online bank. SoFi provides financial products including student loan refinancing, mortgages, personal loans, credit card, investing, and banking through both mobile app and desktop interfaces.
One of the biggest reasons we even looked at this chart is because we see soooooo many traders posting and chatting about it on social media explaining why price has bottomed and has no where to go but up...
Not so fast my friends!
First of all, we've been around long enough and have learned to "never say never." If you know, you know... and if you don't know that you'll probably find out one day.
Regardless of all the chatter, we wanted to review their chart from a price action technical analysis perspective.
Monthly Chart
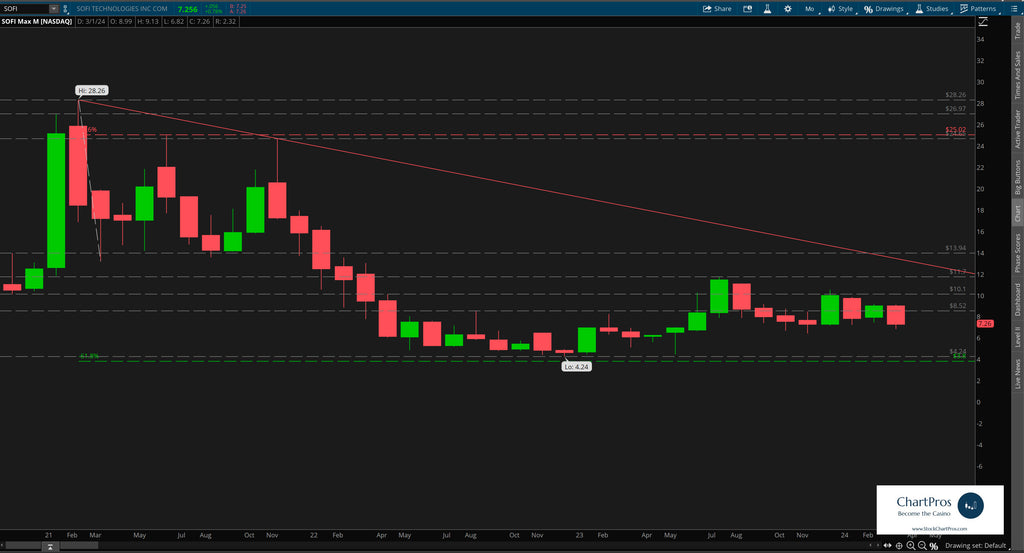
On the monthly chart we can see that relatively speaking there isn't a ton of historical price action data so the chart may still be going through what we consider a "discovery phase."
But for what information does exist we've plotted a bear Fibonacci using the $28.26 all time high (ATH) set in February 2021 as the top anchor and the next low down near $14 as the bottom anchor. Price gave a nice 78.6% retracement before falling out of the sky as some have stated.
When using Fibonacci, price can often (but not always) complete what we call profit target 1 at the -23.6% (it did and we removed that from the chart) and profit target 2 at the -61.8%. In this case, the -61.8% (marked in green) has yet to be filled...
Weekly Chart
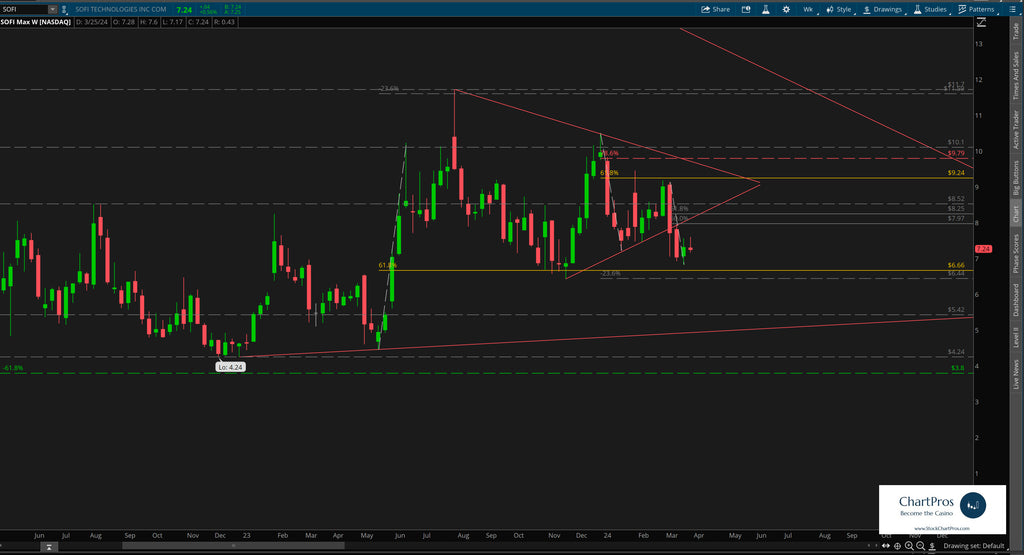
Down on the weekly chart we can see price trying to make a series of higher highs and higher lows but is currently in danger of breaking that and falling back to the downside.
Can the SoFi bulls step in to push price back up or will they possibly give in and let price keep fading.
If price decides to continue falling a potential target area could be the structure we've outlined down below. If those levels were to fail, the bottom could really fall out as they say.
Armed with precision oriented charts like these both traders and investors can formulate their respective plans.
So what's next?
We don't make predictions...
Nobody knows for sure but using these 5 price action tools traders and investors can develop levels of interest in both directions.
- Support/Resistance
- Trend
- Fibonacci
- Supply/Demand Zones,
- Change Control Zones
ChartPros provides the exact methodology in its price action technical analysis courses to create charts like this with the most precise and accurate levels from which investors and traders can formulate their respective trade plans.
Take a look at the charts and let us know what you think.
We'd like to hear from you in the comments sections.
