ChartPros Market Insights
I NEVER Believed in Technical Analysis Until I Realized This...


When I was in MBA school back in the late 1980s (yeah that's me back then long before gray hair) it was drilled into me that a company’s stock price was always tied to its financial statements. You know, Profit and Loss statements, Balance Sheets, etc and all that fancy financial lingo.
And so I went through much of my early adult life not really ever knowing otherwise. But along the way I had heard of this “technical analysis” stuff but considered it something like voodoo or witchcraft because as far as I knew it had absolutely nothing to do with the fundamentals of a company’s financial performance.
Market Insights Briefing | Recorded Thursday 10/12/2023


Market Insights Briefing:
Conquer Trading Discipline and Consistency by Building Your Mental Edge
Recorded Thursday October 12, 2023
This is What I'm Binge Watching this Weekend


What I Like to Binge Watch:
- Billions (the hit series on Showtime)
- Shark Tank
- Blue Bloods (my dad is a retired police officer)
- Trading Education Courses...
Yes, Trading Education Courses!
See which ones...
ChartPros partners with New Trader University - Steve Burns
ChartPros has become a New Trader University partner which is led by world renowned trader Steve Burns.
Steve plans to feature and highlight ChartPros expertise with Fibonacci and periodically will provide access to ChartPros free trading tips and price action courses.
May 30 Chart of the Day - S&P 500

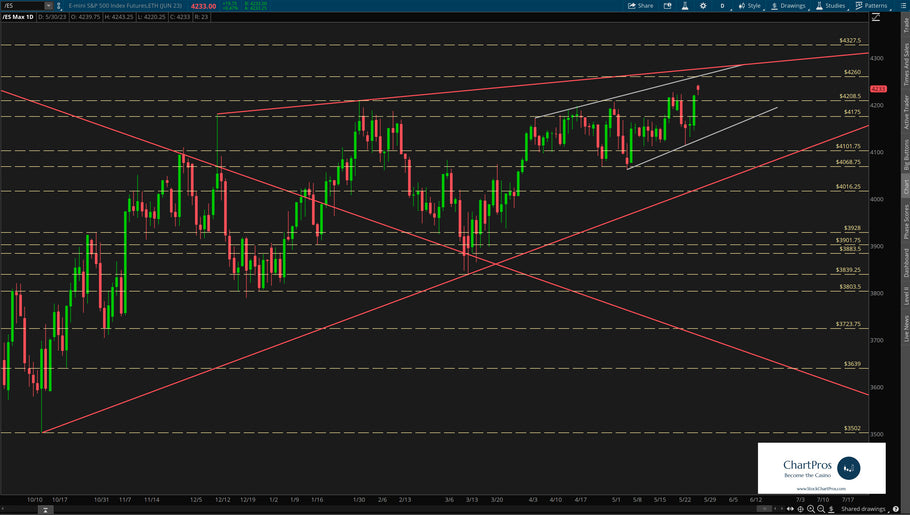
While the New York Stock Exchange (NYSE) was closed Monday in observance of Memorial Day the global after-hours electronic trading system (GLOBEX) opened as normal Sunday evening at 6pm eastern time. And given the US debt ceiling headline news over the long weekend the S&P 500 futures ticker /ES gapped up about 20 points on the open to keep the bulls firmly in control.
On the current ES weekly chart I've only marked it up with Support/Resistance and Trend. Also known as basic structure. In this view traders can see that price often ping pongs between historical levels before proceeding in its next direction.
Transform your trading in just 8 weeks with this Free Trading Psychology Master Class – Watch Now!"


Tired of struggling with destructive trading habits that keep you from reaching your trading goals?
This program is for full or part time traders with ambitious income goals!
Introducing the Complete Trading Psychology System to End Destructive Habits and Reach Pro-Level Consistency... in just 8 Weeks!
Master Your Mindset and Take Control of Your Trading
S&P 500 (Ticker /ES) Trade Plan for February 23

Forex Grid Trade Plan | February 13, 2023

S&P 500 Trade Plan

S&P 500 Recap for February 9, 2023

Is the S&P 500 Bear Market Over?

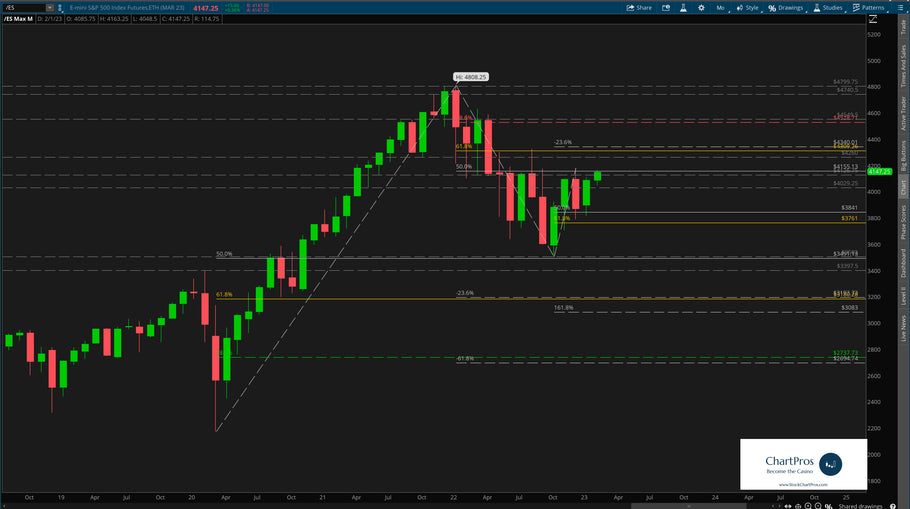
By definition, a bear market is when price drops 20% or more from its recent or all time highs. So for the S&P 500 ticker /ES one could say that technically speaking the bear market is over because price is now approximately 15% off the all time high set back in October 2021.
But is the recent run up simply a "Bear Market Rally" or are the bulls firmly back in charge gunning for new all time highs? See this before your next trade!
The Rise and Fall of Bitcoin from a Price Action Technical Analysis Perspective

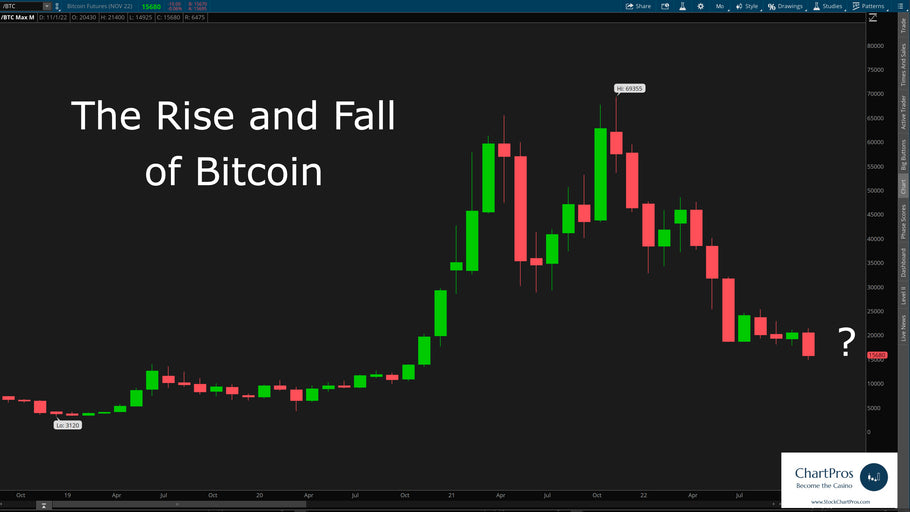
Seems like all the self proclaimed charting experts are suddenly appearing to claim that they "knew" that Bitcoin (ticker BTC) was going to top out and make the free fall that it did... Not so fast my friends!
For well over the past year traders have been asking us what we thought about Bitcoin and our honest answer has consistently been "it doesn't matter what we think about Bitcoin but what's important is what story the BTC chart has been telling us... You just have to know how to listen to it and pickup on the clues that it provides."
- Previous page
- Page 2 of 5
- Next page