ChartPros Market Insights
FREE Trade Entry Timing Course

You may have heard about our new MIFGE program (Most Incredible Free Gifts Ever) where we provide traders FREE access to all of our price action trading courses who join our Highly Rated Trade Room.
It's all part of our "Pay It Forward - Traders Helping Traders" philosophy and this week for the first time ever we've added another level of FREE!
For a limited time you can GET FREE ACCESS to our Trade Entry Timing Course!
June 5 Chart of the Day - The VIX


Historically, whenever VX has been under 20 the overall market sentiment has been bullish.
Taking a look at the weekly and daily VX charts traders can see that price is approaching some potential levels of support.
Does this mean that the markets will change on a dime? Not necessarily...
FOMC Day = Volatility!


Bear Market Trading Strategies (and their Steep Bull Rallies) Webinar


You'll see the only Price Action tools needed that are native to every charting platform and how to apply them in the current volatile conditions.
As a BONUS participants will be introduced to the ChartPros Trade Entry Timing Tool that can be used anticipate market moves across a variety of timeframes and trading styles!
Recorded Thursday November 3rd, 2022 04:30 PM Eastern Time
Here's How to Anticipate Big Market Moves

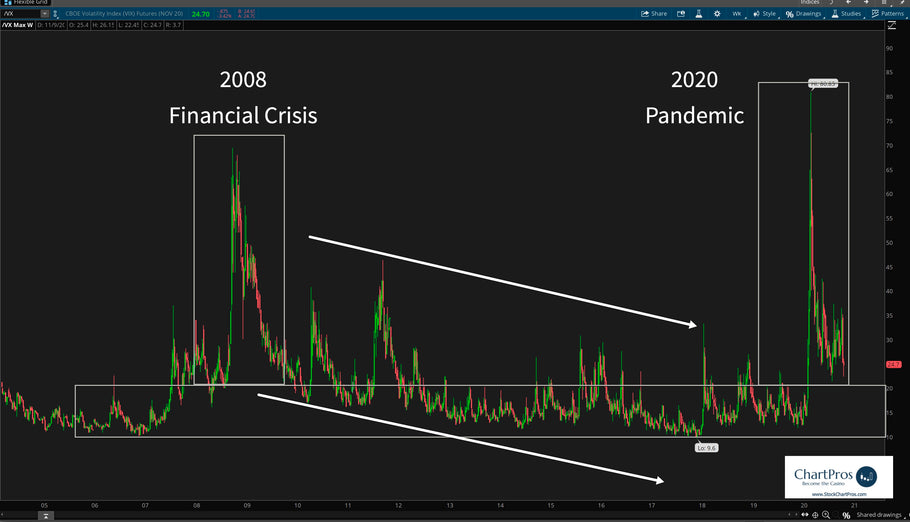
The Volatility Index (VIX) moves inversely to the indices and can often be an indicator of upcoming market moves...
Join us as we walk you through the specific details of the correlation between the VIX and the rest of the market and how to incorporate this relationship into your trading style to increase confidence and consistency!
This course normally sells for $129 but for a limited time you can enroll for the incredibly low price of only $29!
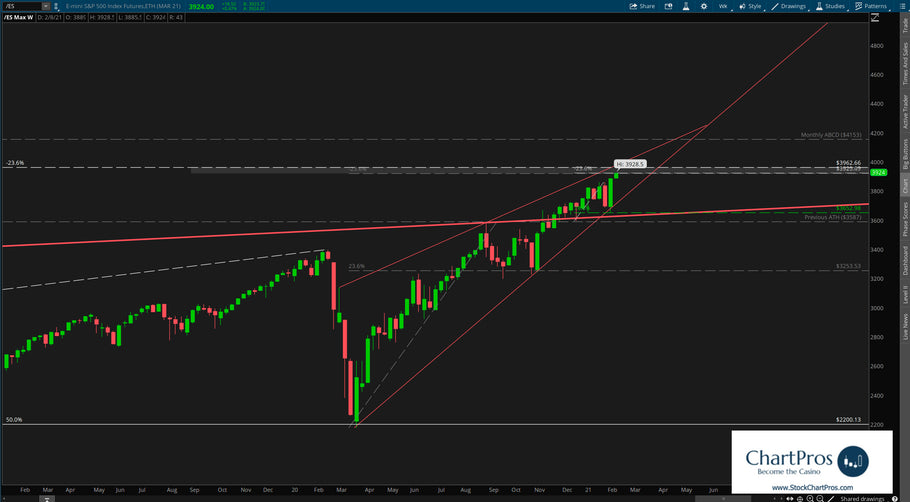
Is the Market About to Crash?


S&P 500 (/ES) Weekly Chart

Around the Markets - 2 minute outlook for the week of January 31, 2021


Around the Markets - 2 minute outlook for the week of November 15, 2020


Introduction to the Trade Entry Timing Tool - FREE Webinar Recording

