ChartPros Market Insights
S&P 500 (Ticker /ES) Trade Plan for February 23

Forex Grid Trade Plan | February 13, 2023

S&P 500 Trade Plan

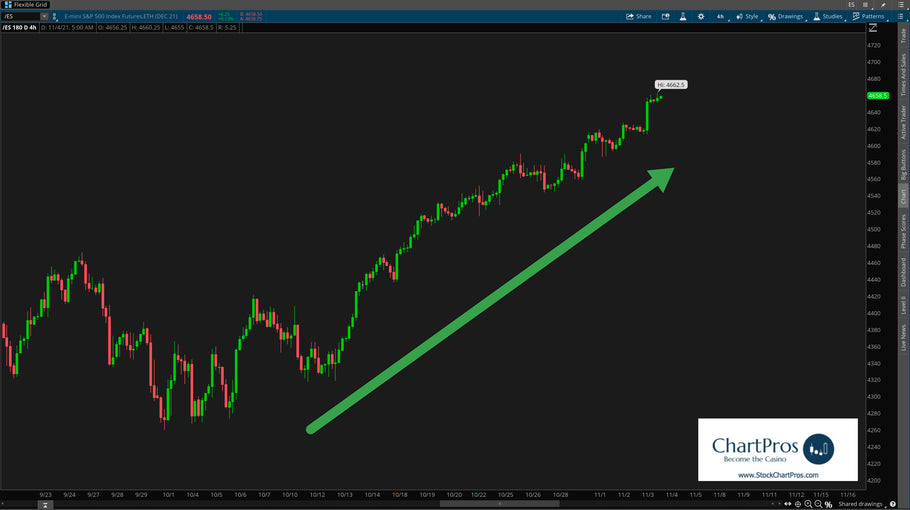
Is the S&P 500 Bear Market Over?

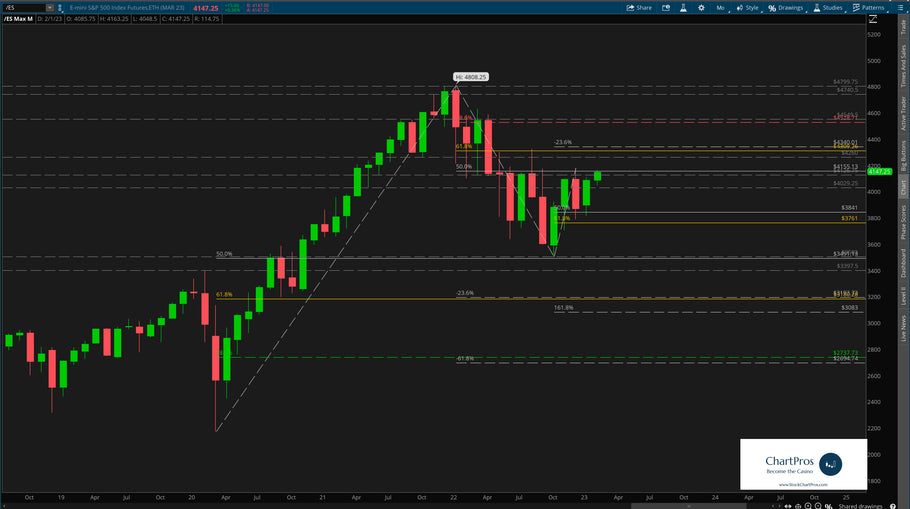
By definition, a bear market is when price drops 20% or more from its recent or all time highs. So for the S&P 500 ticker /ES one could say that technically speaking the bear market is over because price is now approximately 15% off the all time high set back in October 2021.
But is the recent run up simply a "Bear Market Rally" or are the bulls firmly back in charge gunning for new all time highs? See this before your next trade!
The Rise and Fall of Bitcoin from a Price Action Technical Analysis Perspective

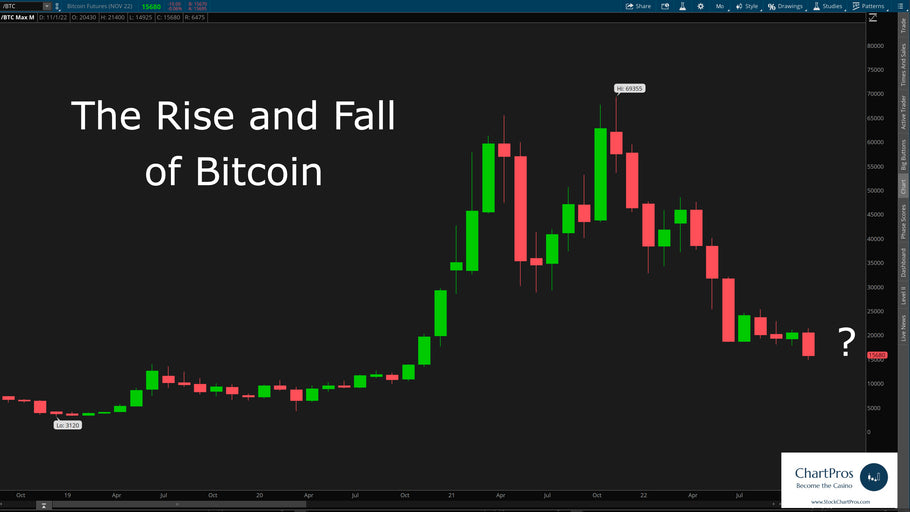
Seems like all the self proclaimed charting experts are suddenly appearing to claim that they "knew" that Bitcoin (ticker BTC) was going to top out and make the free fall that it did... Not so fast my friends!
For well over the past year traders have been asking us what we thought about Bitcoin and our honest answer has consistently been "it doesn't matter what we think about Bitcoin but what's important is what story the BTC chart has been telling us... You just have to know how to listen to it and pickup on the clues that it provides."
FOMC Day = Volatility!


Bear Market Trading Strategies (and their Steep Bull Rallies) Webinar

You'll see the only Price Action tools needed that are native to every charting platform and how to apply them in the current volatile conditions.
As a BONUS participants will be introduced to the ChartPros Trade Entry Timing Tool that can be used anticipate market moves across a variety of timeframes and trading styles!
Recorded Thursday November 3rd, 2022 04:30 PM Eastern Time
Market have you feeling down after that sell off?

Market have you feeling down after that big sell off? Did you like many others try to catch that falling knife?
Learn what over 4K other traders have in ChartPros Price Action Mastery certification course to become more confident and consistent with your trading results.
S&P 500 Market - Higher Timeframe Technical Analysis

New Year Resolutions for Traders


But what about your trading? Have you made resolutions before? Like have more discipline? More patience? Stop chasing trades? Some may even consider quitting trading altogether? Read more...
How High Can the Markets Go?

We frequently get asked "How High Can the Markets Go?"
The true answer is no one really knows for sure but technical analysis can help determine potential targets.
Once a market reaches its target there's no telling what can happen then. The prudent thing as a trader is to allow it time to develop new structure.
Price Targets for Oil - $100??


Remember last year when Oil (symbol /CL) went under $7 a barrel? Well if you got long then and stayed long you would have about10x return now...
We hear woulda, shoulda, coulda a lot.
Here are some updated higher time frame upside price targets for Oil. It's not out of the question to see $100 technically speaking.
- Previous page
- Page 2 of 4
- Next page