ChartPros Market Insights
ChartPros offers Tradevestor Club Membership and Courses

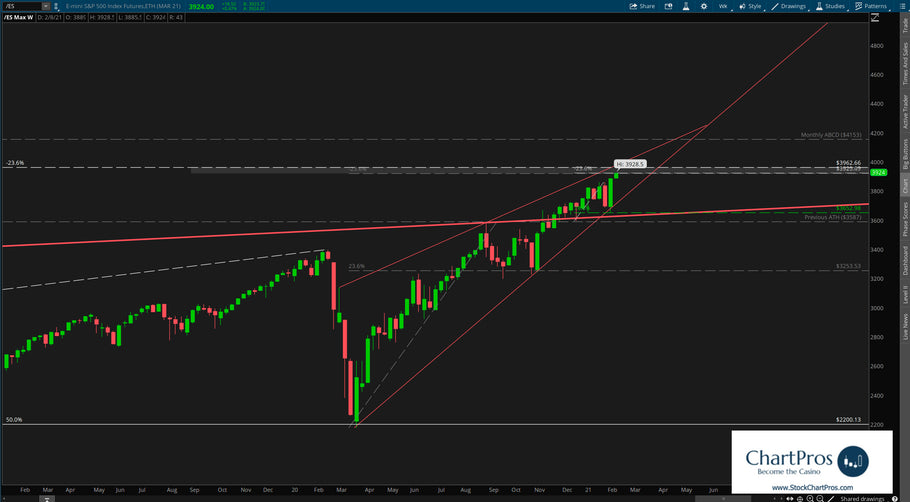
Trade Using Only Support/Resistance and Trend


S&P 500 (/ES) Weekly Chart

Around the Markets - 2 minute outlook for the week of January 31, 2021

Discover Top Trading Psychology & Mindset Techniques Webinar Recording


Around the Markets - 2 minute outlook for the week of November 15, 2020


Introduction to the Trade Entry Timing Tool - FREE Webinar Recording


Market Calm Before the Election Storm... What to Anticipate


Advanced Futures Course with Michael Perrigo


ChartPros launched its latest market education leading course "Advanced Futures".
This course takes traders through advanced strategies and preparations for trading indice futures.
The course is broken into three sections and will walk traders through step by step some of the most advanced strategies and techniques for day and swing trading.
Traders are going to learn how to identify Fibonacci sequences used by institutional algorithms and how to leverage that knowledge in your trading.
We're also going to provide insights into risk management and how to create "risk free" trade scenarios.
Lastly, we take traders through some trade planning and trade recaps that apply the techniques taught in the course.
How to Use 5 Price Action Tools to Boost Your Confidence and Improve Your Consistency


Indices Futures Charts and Video Analysis


We wanted to do this higher time frame daily futures grid and video for you on ES, NQ, and YM.
You’ll notice that nothing goes below the daily so not likely to be useful on intraday trades.
Anatomy of a Potential Entry


A frequently asked question we get so often is how do we determine a potential entry level where there are multiple levels of interest within a particular zone or area.
So here is a brief 4 minute video on the Anatomy of a Potential Entry on USD/CAD for June 8, 2020.
- Previous page
- Page 3 of 4
- Next page